Check Your Privilege: The Curious Case of ETW's SecurityTrace Flag
Introduction
Recently, while investigating new feature development for our Origin (by Prelude) Runtime Memory Protection research preview product, we were forced to dig into the inner-workings of Event Tracing for Windows (ETW). In the course of leveraging our internal ETW tooling, which executes at a signing and protection level of Antimalware Protected Process Light (PPL), we noticed that it was possible to issue a "stop trace" code to a target ETW session that had an undocumented "security trace" flag enabled - which will be the topic of this blog post - without (seemingly) the necessary privileges required. This undocumented flag appears to ensure that only processes running at Antimalware-PPL can interact with or modify any ETW trace session with this flag enabled. In practice, it seems most applicable to AutoLogger ETW trace sessions (as we will see later). Yet we were able to stop the trace session with only administrative privileges, without any special signing or elevated protection level. If you're familiar with Windows internals you will know that - even if not officially acknowledged - resources created or managed by a protected process generally should not be modifiable by less-privileged entities, including administrative processes. Given that this flag appears to delegate trace-session management exclusively to Antimalware-PPL processes, our interest was piqued.
As we set out to determine how any of this was possible in the first place, this led us to identifying both how to configure and manage this undocumented "security trace" ETW flag without needing Antimalware-PPL. However, and much more practical and impactful, this allowed us to identify a new method to consume events from ETW providers which require Antimalware-PPL, like Microsoft-Windows-Threat-Intelligence, without running as Antimalware-PPL and without relying on a kernel driver - or any of the usual "patch-the-kernel" gymnastics researchers have historically relied on. Alongside this post, we are also releasing a public proof of concept that encapsulates this research: ThreatIntelligenceConsumer.
ETW Session Management
Although the functionality for creating and managing ETW sessions is exposed in user-mode on Windows, the kernel is still responsible for the true management of resources related to trace sessions. One of the primary structures used by the kernel to manage a specific ETW session is through the WMI_LOGGER_CONTEXT structure.
lkd> dt nt!_WMI_LOGGER_CONTEXT
   +0x000 LoggerId         : Uint4B
   +0x004 BufferSize       : Uint4B
   +0x008 MaximumEventSize : Uint4B
   +0x00c LoggerMode       : Uint4B
   +0x010 AcceptNewEvents  : Int4B
   +0x018 GetCpuClock      : Uint8B
   +0x020 LoggerThread     : Ptr64 _ETHREAD
   +0x028 LoggerStatus     : Int4B
   +0x02c FailureReason    : Uint4B
   +0x030 BufferQueue      : _ETW_BUFFER_QUEUE
   +0x040 OverflowQueue    : _ETW_BUFFER_QUEUE
   +0x050 GlobalList       : _LIST_ENTRY
   +0x060 DebugIdTrackingList : _LIST_ENTRY
   +0x070 DecodeControlList : Ptr64 _ETW_DECODE_CONTROL_ENTRY
   +0x078 DecodeControlCount : Uint4B
   +0x080 BatchedBufferList : Ptr64 _WMI_BUFFER_HEADER
   +0x080 CurrentBuffer    : _EX_FAST_REF
   +0x088 LoggerName       : _UNICODE_STRING
   +0x098 LogFileName      : _UNICODE_STRING
   +0x0a8 LogFilePattern   : _UNICODE_STRING
   +0x0b8 NewLogFileName   : _UNICODE_STRING
<--- Truncated --->
This structure, which is quite large, manages a lot of the data and metadata needed for the session including the name of the logger, the state of ETW buffers being written to, Last Branch Record (LBR) and Intel Processor Trace (IPT) ETW enablement status if applicable, flags, and other items of interest. For the purposes of this blog post, we will examine the various flags which are present.
+0x330 Flags            : Uint4B
+0x330 Persistent       : Pos 0, 1 Bit
+0x330 AutoLogger       : Pos 1, 1 Bit
+0x330 FsReady          : Pos 2, 1 Bit
+0x330 RealTime         : Pos 3, 1 Bit
+0x330 Wow              : Pos 4, 1 Bit
+0x330 KernelTrace      : Pos 5, 1 Bit
+0x330 NoMoreEnable     : Pos 6, 1 Bit
+0x330 StackTracing     : Pos 7, 1 Bit
+0x330 ErrorLogged      : Pos 8, 1 Bit
+0x330 RealtimeLoggerContextFreed : Pos 9, 1 Bit
+0x330 PebsTracing      : Pos 10, 1 Bit
+0x330 PmcCounters      : Pos 11, 1 Bit
+0x330 PageAlignBuffers : Pos 12, 1 Bit
+0x330 StackLookasideListAllocated : Pos 13, 1 Bit
+0x330 SecurityTrace    : Pos 14, 1 Bit
+0x330 LastBranchTracing : Pos 15, 1 Bit
+0x330 SystemLoggerIndex : Pos 16, 8 Bits
+0x330 StackCaching     : Pos 24, 1 Bit
+0x330 ProviderTracking : Pos 25, 1 Bit
+0x330 ProcessorTrace   : Pos 26, 1 Bit
+0x330 QpcDeltaTracking : Pos 27, 1 Bit
+0x330 MarkerBufferSaved : Pos 28, 1 Bit
+0x330 LargeMdlPages    : Pos 29, 1 Bit
+0x330 ExcludeKernelStack : Pos 30, 1 Bit
Although the mask of flags is technically represented by WMI_LOGGER_CONTEXT.Flags, the symbols contain a convenient breakdown of the various values which are available. As we can see, SecurityTrace is a flag which is present and will be the subject of this blog post. By itself, however, this flag does not indicate what it is used for, other than the fact that it denotes the trace is somehow related to security.
To get a sense as to what this flag may be used for, we first enumerated all of the trace sessions which contained this flag. Note that the list of active loggers cannot exceed 0x50 (80), as this currently is the maximum number of supported loggers on a system. WinDbg, which we use for our research, is a very powerful tool for ETW analysis.
lkd> dx ((nt!_WMI_LOGGER_CONTEXT*(*)[0x50])(((nt!_ESERVERSILO_GLOBALS*)&nt!PspHostSiloGlobals)->EtwSiloState->EtwpLoggerContext))->Where(l => l != 1).Where(l => l->SecurityTrace == 1).Select(i => i->LoggerName)
((nt!_WMI_LOGGER_CONTEXT*(*)[0x50])(((nt!_ESERVERSILO_GLOBALS*)&nt!PspHostSiloGlobals)->EtwSiloState->EtwpLoggerContext))->Where(l => l != 1).Where(l => l->SecurityTrace == 1).Select(i => i->LoggerName)
    [5]              : "DefenderApiLogger" [Type: _UNICODE_STRING]
    [6]              : "DefenderAuditLogger" [Type: _UNICODE_STRING]
There are only two trace sessions with this feature enabled - DefenderApiLogger and DefenderAuditLogger. These trace sessions are associated with Microsoft Defender. If one attempts to analyze the relevant binaries, you will not find the creation of these ETW sessions present (via StartTrace). This is because these sessions are registered as AutoLogger ETW sessions. For the unfamiliar, AutoLogger sessions are used in order for some loggers to consume events fairly early (all things considered) in the boot process and are not created by a particular process, but instead are created by the kernel directly (unlike most "normal" sessions - which are created by a particular process invoking StartTrace). These sessions are configured through the Registry via HKEY_LOCAL_MACHINE\SYSTEM\CurrentControlSet\Control\WMI\Autologger.

By examining one of the AutoLogger sessions associated with Microsoft Defender we can glean further insight, potentially, into the SecurityTrace feature.

The DefenderApiLogger key itself contains AutoLogger-compliant configuration settings (not all of the ETW trace session configuration settings are available to AutoLoggers). As we can see in the above image, there are no configuration options related to "Flags" or any other moniker which would indicate configuration of various features such as SecurityTrace, etc. Moreover, if we put AutoLogger sessions aside and look at the EVENT_TRACE_PROPERTIES structure, which is used by callers of StartTrace to create a new ETW session programmatically, there still are no options to configure an item such as a "security trace" feature or a SecurityTrace flag.
In the case of DefenderApiLogger, all that is present are a list of AutoLogger-compliant ETW settings, along with a list of GUIDs for the various ETW providers which the DefenderApiLogger trace session wishes to consume from. For example, the Microsoft-Windows-Services ETW provider is represented by the first GUID present in the subkey, 0063715B-EEDA-4007-9429-AD526F62696E. Each of these keys contains additional settings, such as the configuration of how a particular provider should emit events or how the logger should consume them - including an additional subkey named "Filters" (if present) which denotes various ETW filters (event ID filtering, etc.).
Still, however, there is nothing particularly identifiable about any of these configuration settings that would indicate the configuration of SecurityTrace. Given that the WMI_LOGGER_CONTEXT structure is a kernel-only structure, we further sought to understand how the ETW runtime in kernel-mode manages the undocumented SecurityTrace feature.
SecurityTrace Logger Flag
We've mentioned the SecurityTrace flag - but what does it actually do? One of the clearest ways to answer this is to look where this flag is evaluated (or set). The primary place where SecurityTrace is evaluated is in the Windows kernel, specifically the EtwpQueryTrace. As the name suggests, this function handles queries against a target ETW session. In practice, when you use a built-in tool like logman to retrieve details about an ETW trace session, the request ultimately funnels down to EtwpQueryTrace in order to be serviced.
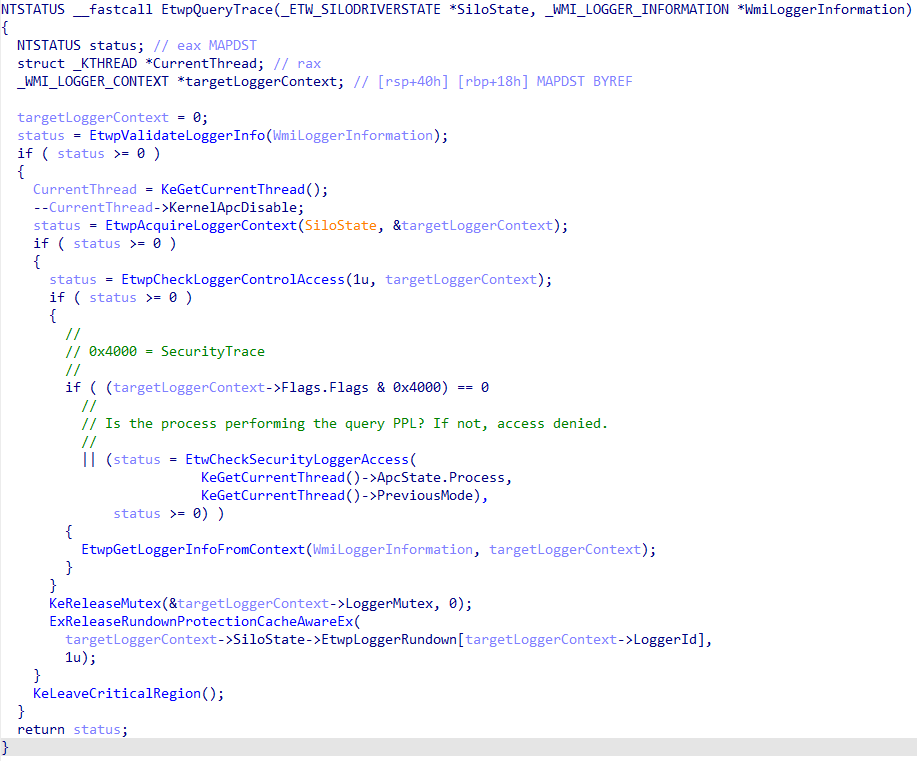
Before talking about how SecurityTrace is evaluated in this function it is worth talking about how queries actually work - as this information will become prevalent in the latter portion of this blog.
ETW session query functionality resides around the WMI_LOGGER_INFORMATION structure. This undocumented structure is what is actually used by the low-level user-mode caller, NtTraceControl (via ControlTrace) for most ETW operations, such as starting or querying a trace. This structure is what is sent to the kernel - not the higher-level (and documented) EVENT_TRACE_PROPERTIES structure present in the Windows SDK. Although the Windows Research Kernel (WRK) has a definition of this structure, it has seen quite a few updates since the WRK was last updated. Luckily, the structure is present in combase.dll (as an aside, COM is notoiously hard to debug, so Microsoft actually ships private symbols for combase.dll. Given COM intersects with much of the OS, it can be a gold mine for information like this).
0:000> dt combase!_WMI_LOGGER_INFORMATION
   +0x000 Wnode            : _WNODE_HEADER
   +0x030 BufferSize       : Uint4B
   +0x034 MinimumBuffers   : Uint4B
   +0x038 MaximumBuffers   : Uint4B
   +0x03c MaximumFileSize  : Uint4B
   +0x040 LogFileMode      : Uint4B
   +0x044 FlushTimer       : Uint4B
   +0x048 EnableFlags      : Uint4B
   +0x04c AgeLimit         : Int4B
   +0x04c FlushThreshold   : Int4B
   +0x050 Wow              : Pos 0, 1 Bit
   +0x050 QpcDeltaTracking : Pos 1, 1 Bit
   +0x050 LargeMdlPages    : Pos 2, 1 Bit
   +0x050 ExcludeKernelStack : Pos 3, 1 Bit
   +0x050 V2Options        : Uint8B
   +0x058 LogFileHandle    : Ptr64 Void
   +0x058 LogFileHandle64  : Uint8B
   +0x060 NumberOfBuffers  : Uint4B
   +0x060 InstanceCount    : Uint4B
   +0x064 FreeBuffers      : Uint4B
   +0x064 InstanceId       : Uint4B
   +0x068 EventsLost       : Uint4B
   +0x068 NumberOfProcessors : Uint4B
   +0x06c BuffersWritten   : Uint4B
   +0x070 LogBuffersLost   : Uint4B
   +0x070 Flags            : Uint4B
   +0x074 RealTimeBuffersLost : Uint4B
   +0x078 LoggerThreadId   : Ptr64 Void
   +0x078 LoggerThreadId64 : Uint8B
   +0x080 LogFileName      : _UNICODE_STRING
   +0x080 LogFileName64    : _STRING64
   +0x090 LoggerName       : _UNICODE_STRING
   +0x090 LoggerName64     : _STRING64
   +0x0a0 RealTimeConsumerCount : Uint4B
   +0x0a4 SequenceNumber   : Uint4B
   +0x0a8 LoggerExtension  : Ptr64 Voidf
   +0x0a8 LoggerExtension64 : Uint8B
WMI_LOGGER_INFORMATION acts as a translation layer to extract information from, or store information into, the target trace session's WMI_LOGGER_CONTEXT from the original EVENT_TRACE_PROPERTIES structure associated with the target operation (such as StartTrace or ControlTrace).
Sechost.dll, the user-mode component which receives the high-level query request from user-mode, translates the EVENT_TRACE_PROPERTIES structure into the appropriate WMI_LOGGER_INFORMATION structure - which then is sent to kernel-mode and is populated by the target WMI_LOGGER_CONTEXT structure. This is then translated back into the expected EVENT_TRACE_PROPERTIES structure provided by the caller of ControlTrace query operation. This translation is achieved in Sechost.dll via EtwpCopyPropertiesToInfo (EVENT_TRACE_PROPERTIES -> WMI_LOGGER_INFORMATION) and EtwpCopyInfoToProperties (WMI_LOGGER_INFORMATION -> EVENT_TRACE_PROPERTIES).
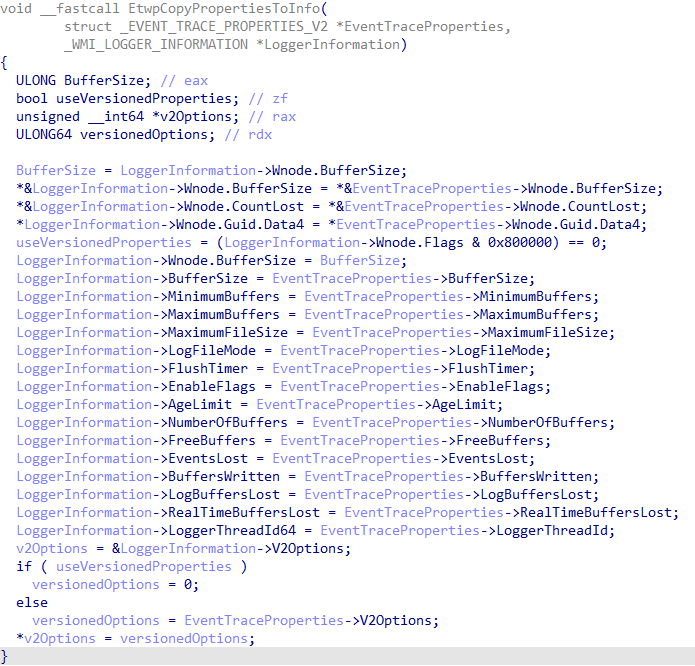
What does this have to do with an ETW "security trace"? The actual functionality of a query operation, as we saw previously in EtwpQueryTrace, is gated by the presence of the target trace session's WMI_LOGGER_CONTEXT.Flags.SecurityTrace bit. In order for the target session's WMI_LOGGER_INFORMATION structure to be populated from the WMI_LOGGER_CONTEXT structure (in other words, in order for a trace query operation to take place), the caller process (i.e., the process which is performing the query, such as logman.exe or any other caller of ControlTrace) must contain at least Antimalware-PPL signing level/privilege.

This means it is not even possible to query these ETW sessions from a process which has, for example, SYSTEM privileges.
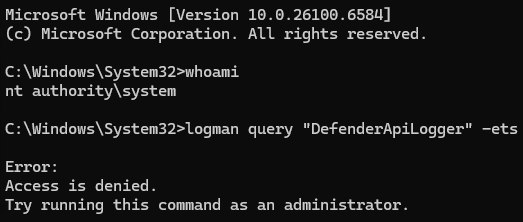
However, the SecurityTrace feature is more useful than just filtering the ability to query a session from user-mode directly via ControlTrace with the EVENT_TRACE_CONTROL_QUERY control code (although it is one of, if not the fundemental operation it is used for). The SecurityTrace flag is also checked in other security-relevant code paths. Curiously, however, the check is not present when the "stop ETW trace session" code path (EtwpStopLogger in Sechost.dll, EtwpStopTrace in NT) is exercised.
In the kernel, the presence of the SecurityTrace bit is checked in EtwpStopLoggerInstance (which is called by EtwpStopTrace). However, the check is not "security-related" (i.e., validating the calling process is running at Antimalware-PPL) and simply is to, if the target trace session had the Microsoft-Windows-Security-Auditing provider enabled, update global information about this provider - which has special handling in the kernel. This is because, as we will see later, one of the ways in which the SecurityTrace feature can be enabled is to consume from the Microsoft-Windows-Security-Auditing ETW provider in a very specific manner.

Given no explicit Antimalware-PPL check occurs (and that a stop operation also does not result in a query, which would implicitly perform the Antimalware-PPL check) between the issuing of the stop code and the trace session being stopped, if the name of the target session with SecurityTrace enabled is known it is still possible for a process with only administrative privileges (SYSTEM in the case of the Defender session due to additional security descriptors) privileges to stop an ETW trace session with the SecurityTrace flag present (even though querying such a session would require the querying process to possess Antimalware-PPL). Though, as just mentioned, additional measures such as security descriptors can further tighten the permissions needed to perform such an action on a trace session.
eventProperties->Wnode.Guid = k_DefenderApiLoggerGuid;
eventProperties->LoggerNameOffset = sizeof(EVENT_TRACE_PROPERTIES);

error = ControlTraceW(0,
                      L"DefenderApiLogger",
                      eventProperties,
                      EVENT_TRACE_CONTROL_STOP);
if (error != ERROR_SUCCESS)
{
    goto Exit;
}

wprintf(L"[+] Successfully stopped DefenderApiLogger trace session.\n");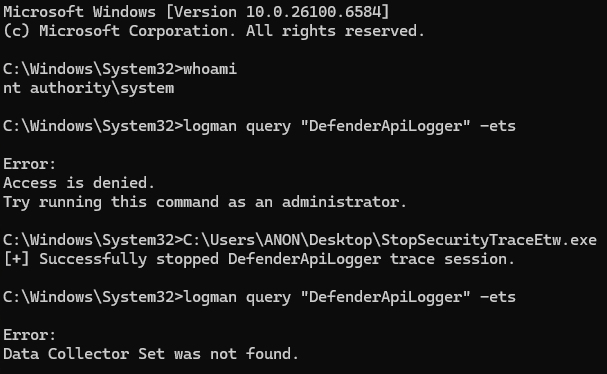
Lastly, SecurityTrace and Antimalware-PPL checks almost always occur in tandem with the EtwCheckSecurityLoggerAccess kernel function. This is the actual function which performs the check for if the requesting/querying process has the necessary privilege (Antimalware-PPL) the operation. This function is also responsible for ensuring that only Antimalware-PPL processes can enable Microsoft-Windows-Threat-Intelligence related telemetry on desired processes. Not all Microsoft-Windows-Threat-Intelligence events are generated by "default" even with the appropriate keywords enabled. For example, processes must be opted-in to emitting specific events, such as reading/writing to/from memory. Processes do not emit these events by default.

To summarize: the point, in our view, of the SecurityTrace flag seems to be to prevent non-Antimalware-PPL processes from accessing ETW data specific to sessions (more specifically, as we will see, AutoLogger trace sessions) with this bit set. This brings up the obvious question: how can one enable this feature in the first place? Additionally, could there be any implications for sessions which have the SecurityTrace feature enabled?
SecurityTrace - AutoLogger Sessions
In our analysis we identified three ways to enable the SecurityTrace feature. The first two methods happen indirectly through the specific configuration of an AutoLogger trace session.
AutoLogger sessions go through a special code path in the kernel in order to have all of the requested providers enabled (this will be important for later in the blog post). AutoLoggers trace sessions have their target providers enabled via EtwpEnableAutoLoggerProvider (instead of EtwEnableTrace directly). This function begins by extracting all of the provider subkeys in the target AutoLogger Registry key entry, iterating by provider GUID. If any of the target providers are either Microsoft-Windows-Kernel-Audit-Api-Calls or Microsoft-Windows-Threat-Intelligence, the target trace's WMI_LOGGER_CONTEXT structure is updated to contain the SecurityTrace flag.
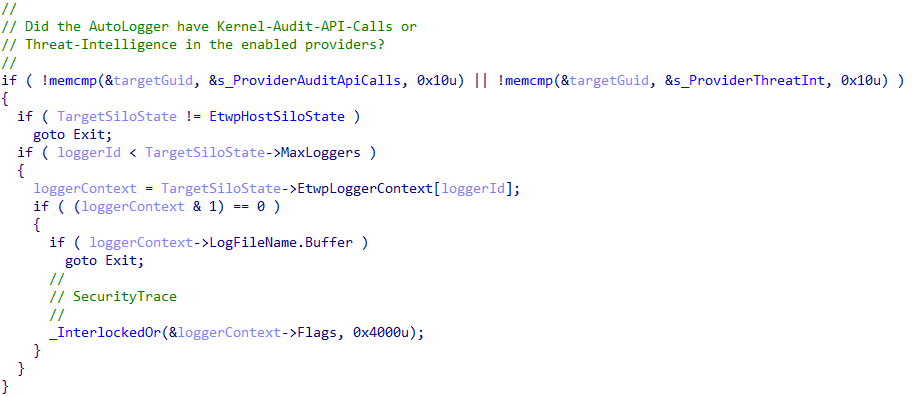
The key here to remember is that the sessions are not started in context of any particular process - meaning there is no Antimalware-PPL check to be done at this point because the requesting "process" is the System process - in other words, the kernel itself. Traditionally, an ETW trace session cannot enable Microsoft-Windows-Threat-Intelligence because of the fact that when EnableTraceEx2 is called, the caller process has its identity verified - and if it is not an Antimalware-PPL process, an access denied error is propogated back to the caller.
The difference for AutoLoggers resides in the fact that there is no check to be done on a caller of EnableTraceEx2 because provider enablement for AutoLoggers it not tied to a particular process identity, as it does not involve a process calling EnableTraceEx2. The kernel itself is responsible for enabling all of the requested providers (which are listed, as previously shown, in the Registry for each AutoLogger). This is why the presence of the SecurityTrace flag is important, as it's purpose is to protect AutoLogger sessions which have enabled privileged providers, like Microsoft-Windows-Threat-Intelligence, from being consumed by non-Antimalware-PPL processes. Although nothing can be done to check the identity of a process enabling a particular provider for an AutoLogger trace session at the time of enablement (as there is no process context to check), the OS can at least delegate this check to later, when a process attempts to then consume from this session. This is exactly where SecurityTrace comes into play.
The second way an AutoLogger can enable this capability is by setting an undocumented, but valid, AutoLogger Registry configuration value. The value in this case is EnableSecurityProvider. This is achieved in EtwpStartAutoLogger in the kernel (note that SecTraceUnion is user-defined and is not the name of the union which is actually used in the WMI_LOGGER_INFORMATION structure we have previously mentioned. Flags in this case is a 1-to-1 mapping of Flags in the target session's WMI_LOGGER_CONTEXT, as we will see later).

As a point of contention, when the EnableSecurityProvider AutoLogger key is set a few additional implicit actions occur. Any AutoLogger which has this key set will automatically be opted-in to consuming the Microsoft-Windows-Security-Auditing ETW provider and the target logger ID is added to the list of known loggers consuming from this provider, via the ETW_SILODRIVERSTATE structure managed PspHostSiloGlobals in the kernel. This is because the EtwpSecurityProviderGuidEntry is always set to the Microsoft-Windows-Security-Auditing provider in EtwpPreInitializeSiloState.
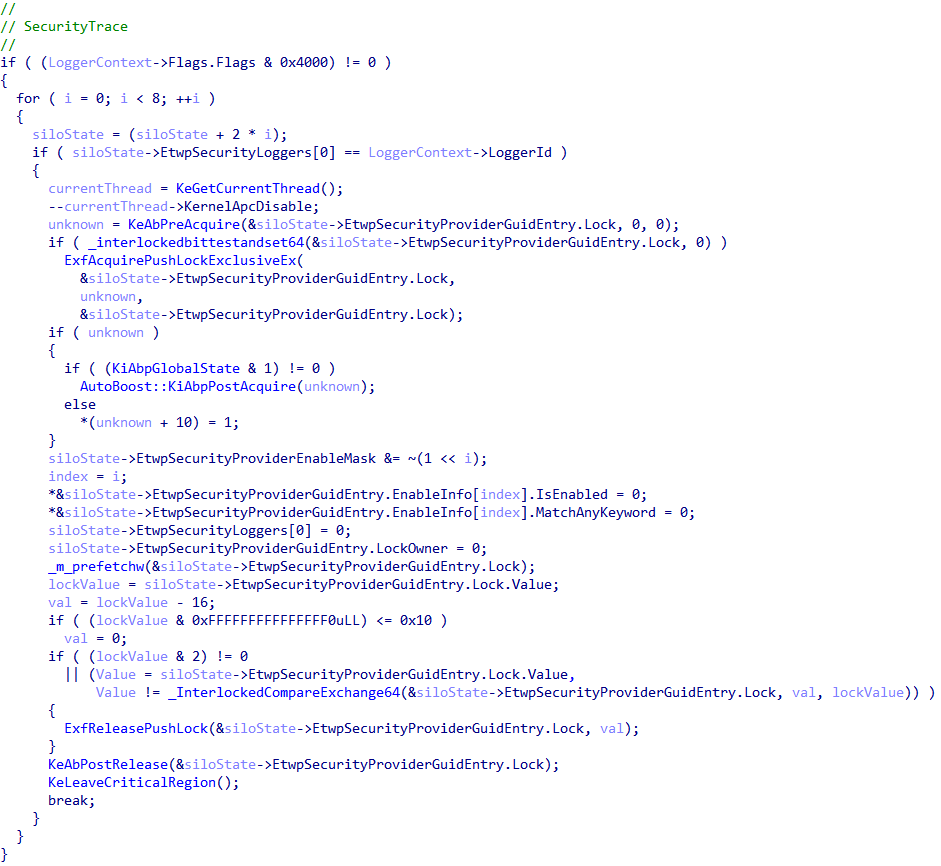
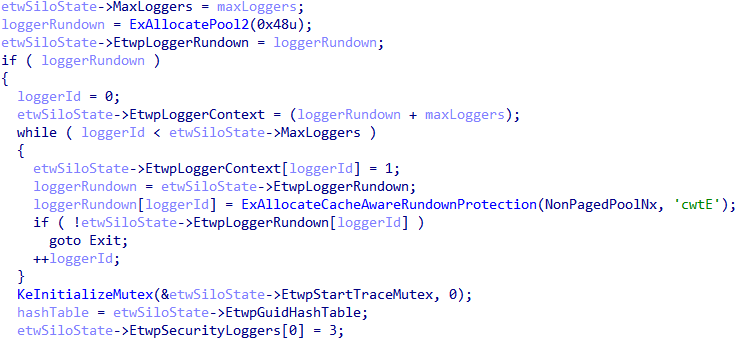
Additionally, the first logger ID in the EtwpSecurityLoggers array is hardcoded, in EtwpPreInitializeSiloState, to the logger ID of 3 - which is always reserved for the EventLog-Security trace session. And, as mentioned, any AutoLogger which specifies the EnableSecurityProvider Registry value will be added to this list - as well as have the SecurityTrace bit enabled.
In addition there is a "non-AutoLogger" method to enable the SecurityTrace flag without running at Antimalware-PPL (and also, for that matter, dynamically/programmatically without the help of the AutoLogger Registry keys). Additionally, we will outline how it is possible to also consume from such traces without Antimalware-PPL.
WMI_LOGGER_INFORMATION
As previously mentioned there is a level of abstraction, in user-mode, between the documented EVENT_TRACE_PROPERTIES structure and the kernel-mode WMI_LOGGER_CONTEXT structure - and that is the WMI_LOGGER_INFORMATION structure. Taking a look at this structure, there is some interesting behavior present. Specifically, Flags and LogBuffersLost:
0:000> dt combase!_WMI_LOGGER_INFORMATION
    <--- Truncated --->
   +0x070 LogBuffersLost   : Uint4B
   +0x070 Flags            : Uint4B
   <--- Truncated --->
As seen above, both of these members are located at the same place in memory (offset 0x70). This infers these two members are actually part of a union (represented by our SecTraceUnion union earlier), and only one of the values can be valid at a time. LogBuffersLost, which is present in the documented EVENT_TRACE_PROPERTIES structure is unioned with another member which is not present in the documented structure: Flags. This Flags member, as we mentioned earlier, is directly imported from the intermediary WMI_LOGGER_INFORMATION structure, provided by user-mode, into the Flags member of the WMI_LOGGER_CONTEXT structure in kernel mode.
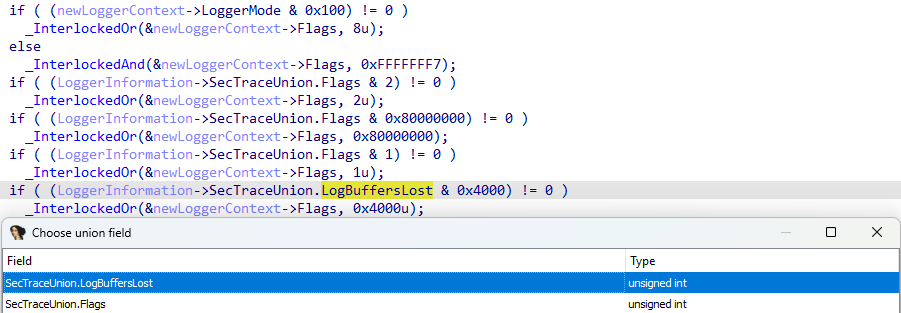
In our case, however, because LogBuffersLost is present in the EVENT_TRACE_PROPERTIES structure passed to StartTrace, and because this is unioned with Flags, if LogBuffersLost is set to 0x4000 in the call to StartTrace (the mask associated with the SecurityTrace bit being set in WMI_LOGGER_CONTEXT.Flags) this value is directly imported into the target WMI_LOGGER_CONTEXT structure! This is because, again, EtwpCopyPropertiesIntoInfo (EVENT_TRACE_PROPERTIES -> WMI_LOGGER_INFORMATION) in Sechost.dll performs a direct copy of the unioned data.
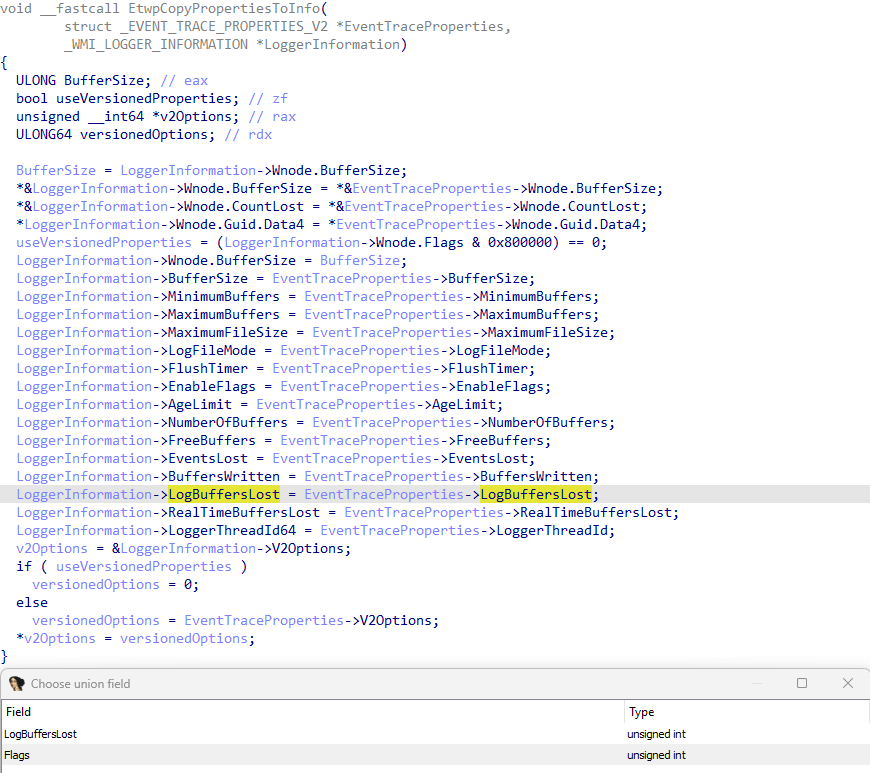
This allows one programmatically to enable SecurityTrace without running at Antimalware-PPL, or without needing to even use an AutoLogger trace session that enables any providers which do require Antimalware-PPL in order to consume from the trace. Additionally, one must set this flag on the call to StartTrace (it is not possible to call ControlTrace with an updated EVENT_TRACE_PROPERTIES containing a new value for LogBuffersLost. This value is ignored in update scenarios by the kernel via EVENT_TRACE_CONTROL_UPDATE).
//
// <snip>
//
traceProperties->LogBuffersLost = 0x4000;  // Treated as "Flags" if 0x4000 is set in nt!EtwpStartLogger.

error = StartTraceW(TraceHandle,
                    TraceName,
                    traceProperties);
if (error != ERROR_SUCCESS)
{
    wprintf(L"[-] Error in StartTraceW! (Error: 0x%lx)\n", error);
    goto Exit;
}
After the call to StartTrace, with LogBuffersLost set to 0x4000, the SecurityTrace bit is set in the target trace's WMI_LOGGER_CONTEXT.
3: kd> dx ((nt!_WMI_LOGGER_CONTEXT*(*)[0x50])(((nt!_ESERVERSILO_GLOBALS*)&nt!PspHostSiloGlobals)->EtwSiloState->EtwpLoggerContext))->Where(l => l != 1).Where(l => l->SecurityTrace == 1).Select(i => i->LoggerName)
((nt!_WMI_LOGGER_CONTEXT*(*)[0x50])(((nt!_ESERVERSILO_GLOBALS*)&nt!PspHostSiloGlobals)->EtwSiloState->EtwpLoggerContext))->Where(l => l != 1).Where(l => l->SecurityTrace == 1).Select(i => i->LoggerName)
    [5]              : "DefenderApiLogger" [Type: _UNICODE_STRING]
    [6]              : "DefenderAuditLogger" [Type: _UNICODE_STRING]
    [41]             : "MyTrace" [Type: _UNICODE_STRING]
So, as we can see, we can still create a trace which prevents any process without Antimalware-PPL from querying the session! This is especially useful for software which wants to create an ETW session that is protected from being discovered by other processes (as no AutoLogger key is needed to do this).
The issue though is that, in its current state, this is completely useless because we still run into an issue when it comes time to actually consume ETW events from this trace session. As we have seen thus far - in almost every scenario where SecurityTrace is enabled, the assumption is the target process consuming from the trace will be running at Antimalware-PPL (even though we know it is possible for a process which is not running at Antimalware-PPL to enable this feature).
In order to consume events (using the documented APIs) we need two calls: OpenTrace and ProcessTrace. OpenTrace and ProcessTrace, for real-time ETW consumers, contain a call to the private function EtwpQueryRealTimeTraceProperties in Sechost.dll.
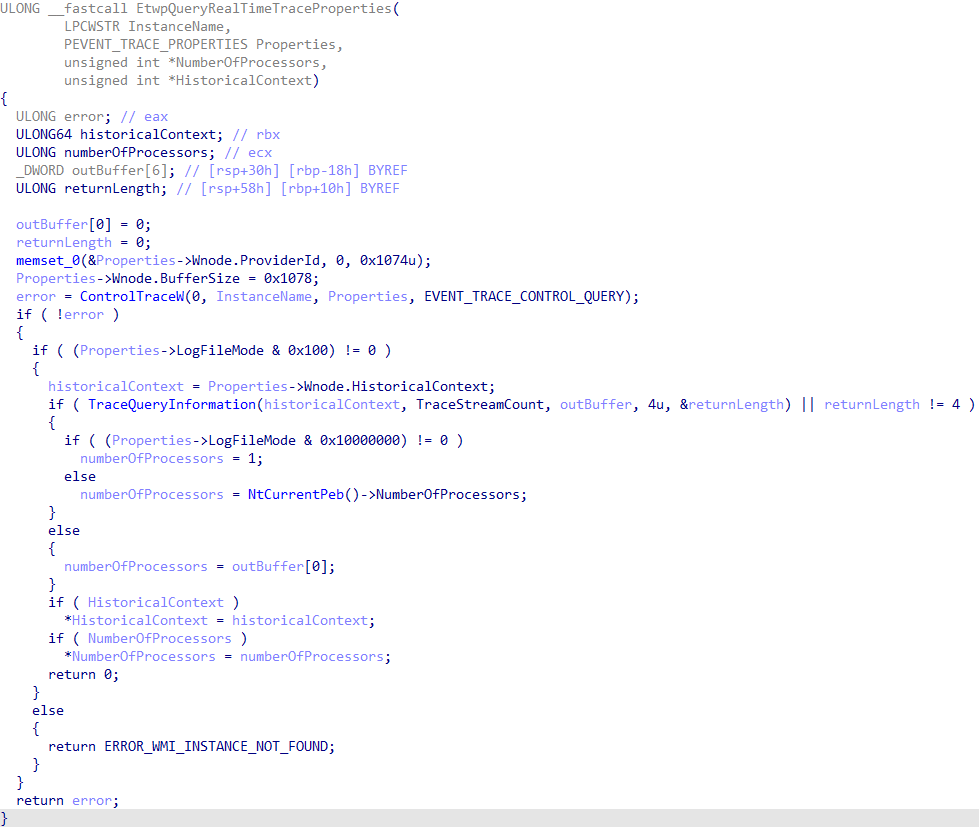
This function occurs inline with OpenTrace and ProcessTrace. The fundamental problem here is that calling both of these functions will implicitly call ControlTrace with the EVENT_TRACE_CONTROL_QUERY code - which results in a query operation to the kernel. As already mentioned, given that SecurityTrace must be set at the time of the call to StartTrace and cannot be updated, the SecurityTrace bit will already be set at the time of the call to EtwpQueryRealTimeTraceProperties. Since query operations result in a check of the SecurityTrace bit (and given our process which is making the calls to OpenTrace and ProcessTrace is not running as Antimalware-PPL) the operation will fail with ERROR_ACCESS_DENIED. Going back to what we mentioned earlier, this is why it is not possible to consume events from a trace session that has SecurityTrace enabled without Antimalware-PPL. However, given that this check is occurring in user-mode, there is more than what meets the eye!
Consuming from a SecurityTrace Session Without Antimalware-PPL
The fundamental reason why consuming fails is due to the query operation. However, given that the check is delegated to user-mode instead of happening inline in the kernel itself as part of a call to NtTraceControl for consuming events, and given that we fully-control the process which is invoking OpenTrace and ProcessTrace - we can bypass this check and consume from any trace session which has SecurityTrace enabled. There are two primary options to choose from:
- Use only native APIs from
ntdll.dll(primarilyNtTraceControl) to consume from the trace session. SinceOpenTraceandProcessTraceare high-level APIs, directly calling the native APIs will result in a bypassing of the query operation - Install a hook on
EtwpQueryRealTimeTraceProperties(orControlTraceitself) to detour all query operations to our own variant. This can be achieved using a supported library like Microsoft Detours, or by installing your own hook.
Due to time constraints we opted for the latter option, which resulted in using our own simple function hook (not using Detours or any other library). Given we opted for a function hook, we needed to compensate for a few things. The first being returning to the caller of EtwpQueryRealTimeTraceProperties all of the information it expects. This includes:
- The number of processors on the system
- The
HistoricalContext(which is referred to as the "trace handle", but really is just the logger ID preserved in theETW_REALTIME_CONSUMERstructure - or additionally the position of the session'sWMI_LOGGER_CONTEXTstructure in theEtwpLoggerContextarray found inPspHostSiloGlobals->EtwSiloStatein the kernel) - The "final"
EVENT_TRACE_PROPERTIESto return to the caller (which needs to be 0x1078 bytes in size) - An
ERROR_SUCCESS(0) return code
However, this is if we choose to install a hook on EtwpQueryRealTimeTraceProperties. Given that this is a private function - as indicated by the Etwp prefix - this function is not exported and it will be a more involved process in order to keep a working POC portable/updated. A more portable method for a POC would be to install a hook on ControlTrace for only query operations. ControlTrace is exported and its address can always be known. Because of this all that is required is returning both a a "success" error code and the output tracing properties. Note that the call to TraceQueryInformation, which is one of the ways the number of processors is retrieved, does not result in an actual call to EtwpQueryTrace in the kernel.
Going back to EtwpQueryRealTimeTraceProperties, the query operation is presumably an artifact of getting a "known good copy" of the target trace properties from the kernel - and additionally so that a check of the SecurityTrace bit can occur. Trial-and-error revealed that simply just providing the EVENT_TRACE_PROPERTIES returned from the original call to StartTrace was sufficient and the queried properties are not necessary. So, for our purposes, all that is needed is to detour calls to ControlTrace for query operations to our own hook and then return to the caller the tracing properties we already have populated from the call to StartTrace! The ControlTrace hook simply identifies if the target operation is a query and, if it is, returns the target trace properties to EtwpQueryRealTimeTraceProperties (which then fills out the HistoricalContext and number of processors as a result of natural execution).
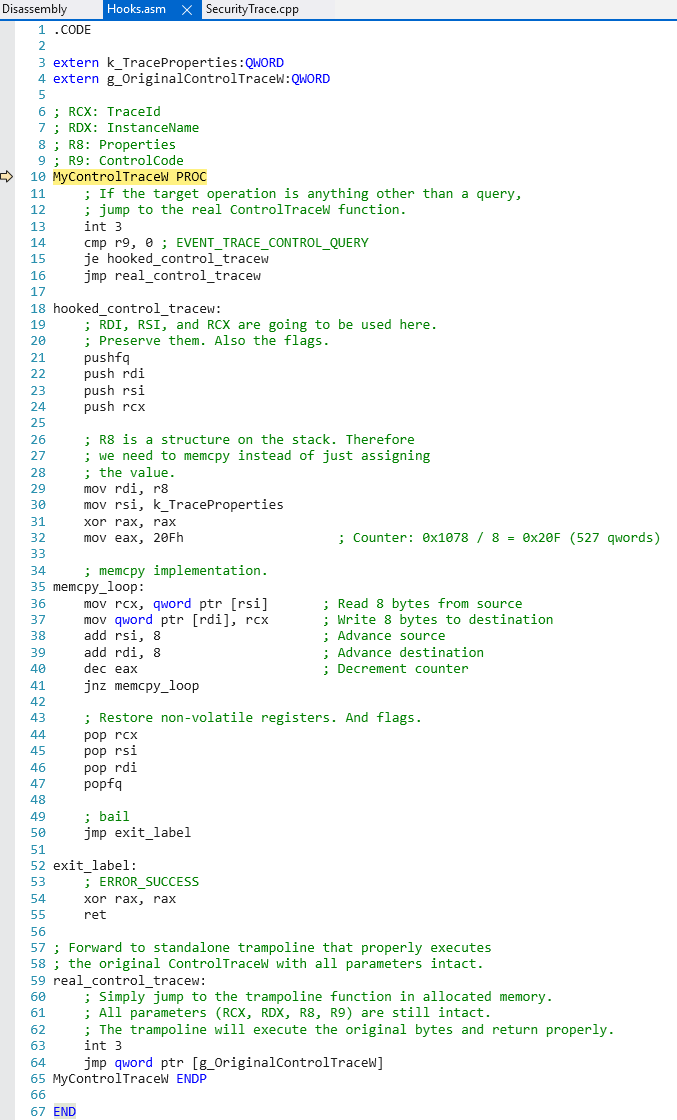
The above code simply returns the necessary information the caller of EtwpQueryRealTimeTraceProperties needs without the actual query operation (which would fail, as mentioned, due to the consuming process not running at Antimalware-PPL). By simply inserting this thunk we can now successfully consume ETW events from a trace session which has the SecurityTrace bit set without Antimalware-PPL! We can also use this exact same method to consume protected ETW providers, like Microsoft-Windows-Threat-Intelligence, without Antimalware-PPL!
Consuming From Microsoft-Windows-Threat-Intelligence Without Antimalware-PPL
As mentioned earlier, the whole point of the SecurityTrace bit is to protect ETW trace sessions that wish to consume from privileged ETW providers, like Microsoft-Windows-Threat-Intelligence - specifically in AutoLogger scenarios. The reason for this is pretty straightforward - the code paths to enable an ETW provider in a target trace session, in the kernel, differ based on if the trace session is an AutoLogger session or not. If the trace session is not an AutoLogger trace session it is impossible to consume from the Microsoft-Windows-Threat-Intelligence provider without being an Antimalware-PPL. This is due to a check which occurs in EtwpCheckNotificationAccess in kernel-mode (recall when the AutoLogger enablement happens there is no "process context" for which EnableTraceEx2 can be invoked, since the kernel is responsible for standing up all AutoLogger sessions).
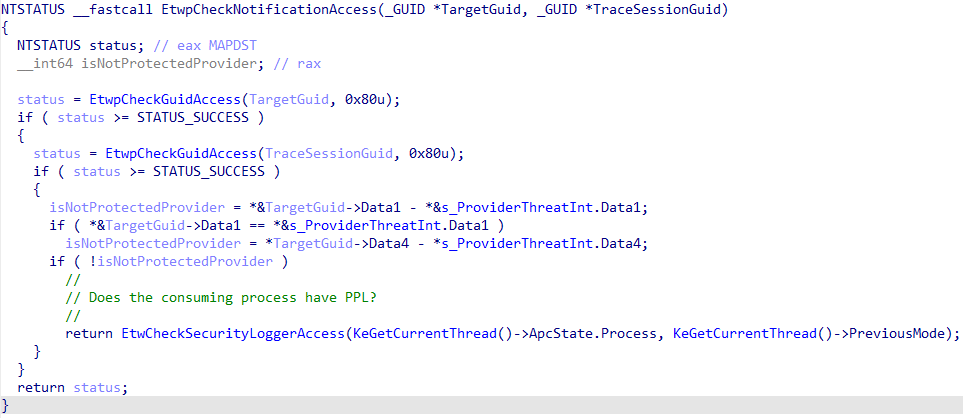
The issue here is that with an AutoLogger ETW trace session the actual check is different. If the Microsoft-Windows-Threat-Intelligence provider is to be consumed by an AutoLogger, only the SecurityTrace flag is checked - there is no call to EtwpCheckNotificationAccess, as there is no process context to validate against. This is because the kernel itself is responsible for instantiating all AutoLogger sessions, not a particular process. We saw this earlier in the blog with how an AutoLogger has the SecurityTrace bit set in the first place. Given this, we can instrument the following:
- Create an entry in the AutoLogger Registry key to consume from Microsoft-Windows-Threat-Intelligence. This will enable Microsoft-Windows-Threat-Intelligence in the trace session. Note that the trace has not yet been consumed by a target process, meaning no Antimalware-PPL check happens because it is not applicable at this state as the kernel is creating all of these sessions - not a particular process
- Patch
ControlTracein user-mode, which allows consumption from a trace that has theSecurityTracebit set. We just need to provide the targetEVENT_TRACE_PROPERTIESstructure - Call
OpenTraceandProcessTraceas normal. This results in everything needed to consume from the session without the query operation we previously showed.
The only challenge in the above implementation is EVENT_TRACE_PROPERTIES. In our original proof-of-concept, we took solace in the fact that we had a fully-populated EVENT_TRACE_PROPERTIES structure after the original call to StartTrace. Given that we are trying to consume from an already-existing AutoLogger session, we can no longer call StartTrace because the session already exists. This means we need to manually populate our own EVENT_TRACE_PROPERTIES structure to return to the caller of EtwpQueryRealTimeTraceProperties in Sechost.dll. Recall that we cannot directly query for these properties without Antimalware-PPL, since SecurityTrace is set. Trial-and-error revealed that the following fields in the EVENT_TRACE_PROPERTIES structure are needed for the call to succeed (and the entirety of the OpenTrace and ProcessTrace operations in general):
- All relevant
WNODE_HEADERfields (Guid, etc.). EspeciallyHistoricalContext BufferSize(a valid value - I have chosen0x40)LogFileMode(EVENT_TRACE_REAL_TIME_MODE)FlushTimerMinimumBuffersLoggerNameOffset
All of the aforementioned fields are trivial to fill out (they just need to be reconciled with the target AutoLogger trace session settings in the Registry) except for HistoricalContext. HistoricalContext, however, is deterministic. This because it is simply, as mentioned, the ID of the logger. Given that we are consuming from an AutoLogger trace session, the only "relevant" IDs will be those present in the AutoLogger Registry key at the time an ID is assigned to our trace session. Additionally, the AutoLoggers are enabled in alphabetical order (with a few exceptions that are easily compensated for).
Through testing, it seems the first logger ID used is always 2 (for the "traditional" kernel logger session), and we also know from earlier that ID 3 is always reserved for the EventLog-Security trace - meaning the first possible ID is 4. Compensating for all of this, one can easily infer what the projected HistoricalContext will be for the target session by brute-forcing all values from 4 - 80 (the maximum ID) with a query operation. AutoLoggers will always reserve the "lower" IDs (starting at 4, 5, 6, etc.) and, thus, iterating over values 4 - 80 until a query to a value that returns ERROR_ACCESS_DENIED is found is a good indicator that the target trace session is likely a SecurityTrace target (although this is not always the case as there can be other reasons why a query can fail that is not related to SecurityTrace). What we are releasing is a POC and, thus, other implementations to reconcile the trace ID are left as an exercise to the reader, as the trace IDs themselves are simply just numeric values and AutoLoggers themselves are enabled in alphabetical order. In the POC we have released, we simply create a trace session name which starts with 0. This all but guarantees, for POC purposes, that this session will be the first ID (4) in the registered trace session, since it will come first alphabetically in most cases.
Finally, with the relevant checks passed, it is then possible to consume from the Microsoft-Windows-Threat-Intelligence ETW provider without Antimalware-PPL or any sort of kernel-mode memory patching or driver loading.
void
HandleThreatIntelligenceCallback (
    _In_ PEVENT_RECORD EventRecord
    )
{
    wprintf(L"[+] [HandleThreatIntelligenceCallback] Hello from the Threat-Intelligence ETW callback!\n");

    //
    // Print the GUID
    //
    wprintf(L"  [*] GUID = {%08lX-%04hX-%04hX-%02hhX%02hhX-%02hhX%02hhX%02hhX%02hhX%02hhX%02hhX}\n",
            EventRecord->EventHeader.ProviderId.Data1,
            EventRecord->EventHeader.ProviderId.Data2,
            EventRecord->EventHeader.ProviderId.Data3,
            EventRecord->EventHeader.ProviderId.Data4[0],
            EventRecord->EventHeader.ProviderId.Data4[1],
            EventRecord->EventHeader.ProviderId.Data4[2],
            EventRecord->EventHeader.ProviderId.Data4[3],
            EventRecord->EventHeader.ProviderId.Data4[4],
            EventRecord->EventHeader.ProviderId.Data4[5],
            EventRecord->EventHeader.ProviderId.Data4[6],
            EventRecord->EventHeader.ProviderId.Data4[7]);

    return;
}
We can see the GUID here is that of the Microsoft-Windows-Threat-Intelligence GUID (F4E1897C-BB5D-5668-F1D8-040F4D8DD344). Additionally, if we enumerate the list of consumers attached to this trace session (via the linked-list in WMI_LOGGER_CONTEXT) for a list of ETW_REALTIME_CONSUMER structures - we can see the only process which is consuming from this trace session, which has enabled the Microsoft-Windows-Threat-Intelligence provider, does not have Antimalware-PPL, and is our proof-of-concept process!
3: kd> dx ((nt!_WMI_LOGGER_CONTEXT*(*)[0x50])(((nt!_ESERVERSILO_GLOBALS*)&nt!PspHostSiloGlobals)->EtwSiloState->EtwpLoggerContext))->Where(l => l != 1).Where(l => l->SecurityTrace == 1).Select(i => new { Name = i->LoggerName, Consumers = Debugger.Utility.Collections.FromListEntry(i->Consumers, "nt!_ETW_REALTIME_CONSUMER", "Links")})[0n4].Consumers[0]
((nt!_WMI_LOGGER_CONTEXT*(*)[0x50])(((nt!_ESERVERSILO_GLOBALS*)&nt!PspHostSiloGlobals)->EtwSiloState->EtwpLoggerContext))->Where(l => l != 1).Where(l => l->SecurityTrace == 1).Select(i => new { Name = i->LoggerName, Consumers = Debugger.Utility.Collections.FromListEntry(i->Consumers, "nt!_ETW_REALTIME_CONSUMER", "Links")})[0n4].Consumers[0]                 [Type: _ETW_REALTIME_CONSUMER]
    [+0x000] Links            [Type: _LIST_ENTRY]
    [+0x010] ProcessHandle    : 0xffffffff800037b0 [Type: void *]
    [+0x018] ProcessObject    : 0xffffa58900524080 [Type: _EPROCESS *]
    [+0x020] NextNotDelivered : 0x0 [Type: void *]
    [+0x028] RealtimeConnectContext : 0x0 [Type: void *]
    [+0x030] DisconnectEvent  : 0xffffa5890188e2e0 [Type: _KEVENT *]
    [+0x038] DataAvailableEvent : 0xffffa5890188e760 [Type: _KEVENT *]
    [+0x040] UserBufferCount  : 0x202d0255450 : Unable to read memory at Address 0x202d0255450 [Type: unsigned long *]
    [+0x048] UserBufferListHead : 0x202d0255448 [Type: _SINGLE_LIST_ENTRY *]
    [+0x050] BuffersLost      : 0x0 [Type: unsigned long]
    [+0x054] EmptyBuffersCount : 0x0 [Type: unsigned long]
    [+0x058] LoggerId         : 0x4 [Type: unsigned short]
    [+0x05a] Flags            : 0x0 [Type: unsigned char]
    [+0x05a ( 0: 0)] ShutDownRequested : 0x0 [Type: unsigned char]
    [+0x05a ( 1: 1)] NewBuffersLost   : 0x0 [Type: unsigned char]
    [+0x05a ( 2: 2)] Disconnected     : 0x0 [Type: unsigned char]
    [+0x05a ( 3: 3)] Notified         : 0x0 [Type: unsigned char]
    [+0x05a ( 4: 4)] Wow              : 0x0 [Type: unsigned char]
    [+0x060] ReservedBufferSpaceBitMap [Type: _RTL_BITMAP]
    [+0x070] ReservedBufferSpace : 0x202d0360000 : Unable to read memory at Address 0x202d0360000 [Type: unsigned char *]
    [+0x078] ReservedBufferSpaceSize : 0x80000 [Type: unsigned long]
    [+0x07c] UserPagesAllocated : 0x0 [Type: unsigned long]
    [+0x080] UserPagesReused  : 0x3d [Type: unsigned long]
    [+0x088] EventsLostCount  : 0x202d0255368 : Unable to read memory at Address 0x202d0255368 [Type: unsigned long *]
    [+0x090] BuffersLostCount : 0x202d025536c : Unable to read memory at Address 0x202d025536c [Type: unsigned long *]
    [+0x098] SiloState        : 0xffffa588f8631000 [Type: _ETW_SILODRIVERSTATE *]

3: kd> dx ((nt!_EPROCESS*)0xffffa58900524080)->Protection
((nt!_EPROCESS*)0xffffa58900524080)->Protection                 [Type: _PS_PROTECTION]
    [+0x000] Level            : 0x0 [Type: unsigned char]
    [+0x000 ( 2: 0)] Type             : 0x0 [Type: unsigned char]
    [+0x000 ( 3: 3)] Audit            : 0x0 [Type: unsigned char]
    [+0x000 ( 7: 4)] Signer           : 0x0 [Type: unsigned char]
As a point of contention for the reader, it is worth noting that this POC is not capable of enabling sources of telemetry which are disabled by default on processes. For example, one still needs Antimalware-PPL in order to call NtSetInformationProcess to enable impersonation events - which have to be explicitly enabled through this privileged system call that this POC is incapable of making. The method outlined here is capable of consuming the following telemetry by default (telemetry that is emitted without a separate privileged system call being made to enable it on a per-process basis):
- Executable memory allocation events (user-mode and kernel-mode callers)
- Executable memory mapping events (user-mode and kernel-mode callers)
- Remote APC events (user-mode)
- Thread context update events (SetThreadContext)
- Kernel-mode device and driver load and unload events
- System call events. At the time this blog post was written, this includes only NtSystemDebugControl and NtQuerySystemInformation system calls
However, it is also worth pointing out that on the latest Insider Preview version of Windows (Canary channel), there are several processes which have already been opted-in to the "optional" telemetry (including memory protection, process/thread suspension, and other events). This means that using the methodology outlined in this blog post will result in receiving such events "for free". This is a result of Microsoft Defender invoking the functionality, since it is a process running at Antimalware-PPL, for enabling the other "optional" telemetry bits.

A list of all processes which have opted-in to the optional Threat-Intelligence telemetry can be seen below:
dx -g @$cursession.Processes.Where(p => (p.KernelObject.EnableProcessImpersonationLogging == 1 || p.KernelObject.EnableProcessLocalExecProtectVmLogging == 1) || p.KernelObject.EnableProcessRemoteExecProtectVmLogging == 1 || p.KernelObject.EnableProcessSuspendResumeLogging == 1 || p.KernelObject.EnableReadVmLogging == 1 || p.KernelObject.EnableThreadSuspendResumeLogging == 1 || p.KernelObject.EnableWriteVmLogging == 1).Select(p => new { Name = p->Name, EnableProcessImpersonationLogging = p.KernelObject.EnableProcessImpersonationLogging, EnableProcessLocalExecProtectVmLogging = p.KernelObject.EnableProcessLocalExecProtectVmLogging, EnableProcessRemoteExecProtectVmLogging = p.KernelObject.EnableProcessRemoteExecProtectVmLogging, EnableProcessSuspendResumeLogging = p.KernelObject.EnableProcessSuspendResumeLogging, EnableReadVmLogging = p.KernelObject.EnableReadVmLogging, EnableThreadSuspendResumeLogging = p.KernelObject.EnableThreadSuspendResumeLogging, EnableWriteVmLogging = p.KernelObject.EnableWriteVmLogging }),d
Conclusion
We have coordinated with Microsoft the findings in this blog post and MSRC has concluded no vulnerability exists due to the administrative <-> PPL boundary which is not enforceable. The SecurityTrace is a pretty obscure and undocumented flag that we found interesting as a result of research we were conducting within the Origin (By Prelude) company - in order to better protect our customers. This blog post would also be incomplete without any recommendation - which would be to move such a check for SecurityTrace traces to the kernel and not delegate it to user-mode. Thank you for reading and we hope you enjoyed this blog post!